Term A/B -- 2016
Location
GH 227
T 6:00-8:50pm
Instructor
Lane Harrison@laneharrison
FL-136
Grader
Ivan Melnikov
Email: imelnikov@wpi.edu
Office Hours
F 2-3
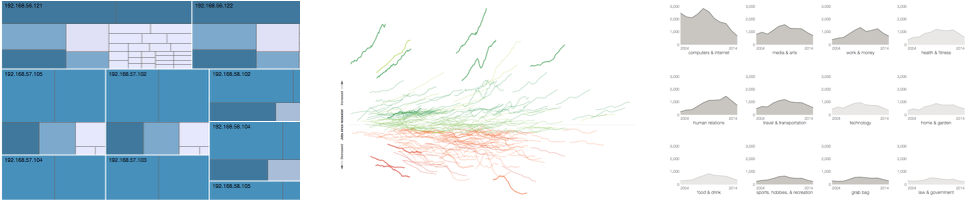
In this course we will study the theory and practice of data visualization. Topics include the fundamental principles, concepts, and techniques of visualization and how visualization can be used to uncover and communicate data-driven insights.
After successful completion of this course, you will be able to:
The text we're using for readings in this course is Visualization Analysis and Design.
While this course primarily focuses on interactive data visualizations using d3, ggplot2 is a fantastic tool for exploratory data analysis and communication. Hadley Wickham, creator of ggplot2 and many other popular R packages, has written his own book entitled ggplot2: Elegant Graphics for Data Analysis (Use R!).
If you're interested in data visualization beyond this class, particularly the algorithms behind visualization techniques, I strongly recommend Ward, Grinstein, and Keim's Interactive Data Visualization: Foundations, Techniques, and Applications.
Request access to team here.
Assignments are the core of this course. Each assignment will focus on a particular aspect of data visualization, such as visualizations network data or criticism and design of existing systems. The lectures and labs will equip you with the background, visualization theory, and technical skills to develop effective visualizations for these datasets.
Every week will include an in-class lab. These labs provide an opportunity for you to learn more about visualization design, data analysis, and technologies.
We'll have a midterm and final based on the readings, labs, assignments, and lectures. These help gauge how well you've understood the material.
We'll be using JavaScript with d3.js to develop visualizations in this course.
You also may have heard of Processing, which is a programming language that sits above Java and facilitates rapid development of graphics applications. If you're experienced with Java, Processing is fun to try.
This term we will be using Slack for class discussion. The system is highly catered to getting you help fast and efficiently from classmates and myself.
Rather than emailing questions to me, I encourage you to post your questions on Slack.
Sign up for our Slack at: https://cs573-16f.slack.com/signup
Grading will be 40% assignments, 20% labs, 30% final project, and 10% exams.
This schedule will change as we calibrate the first few weeks of the course.
Reading: Chapters 1 & 2
Tuesday Aug 30
Topic: Overview of Visualization | Intro to Tools (Code)
Assigned: Assignment 0 - Course Survey
Assigned: Assignment 1 - Hello World: GitHub and d3
Reading: Chapter 3 & 4
Tuesday Sep 6
Topic: Data Representation
Lab: Data Deconstruction
Assigned: Assignment 2 - Data Visualization, 10 ways
Monday Sep 5
Due: Assignment 0 - Course Survey
Due: Assignment 1 - Hello World: GitHub and d3
Reading: Chapter 5 & 6
Tuesday Sep 13
Topic: Visual Channels and Data Mapping
Lab: Data Reconstruction
Reading: Chapter 10
Tuesday Sep 20
Topic: Color
Lab: Color Scales
Assigned: Assignment 3 - Animated Transitions
Monday Sep 19
Due: Assignment 2
Special Event
David Koop, UMass Dartmouth
CS Colloquium, Friday 11am-Noon, Fuller 320
Reading: Chapter 7
Tuesday Sep 27
Topic: Guest Speakers! Mike Barry and Brian Card
Lab: Slopechart
Assigned: CS573 Final Project
Reading: Chapter 8
Tuesday Oct 4
Topic: Tabular Data; Spatial Data
Lab: Maps!
Assigned: Assignment 4
Monday Oct 3
Due: Assignment 3
Reading: Chapter 9
Tuesday Oct 11
Topic: Networks & Trees
MidTerm (Cumulative up through last week)
No Classes: A term to B term transition week
Tuesday Oct 25
Topic: TBA (Lane at IEEE VIS)
Tuesday October 25
Due: Assignment 4
Tuesday Nov 1
Topic: IEEE VIS Recap
Assigned: Assignment 5
Lab: Alcohol Project | Project Proposals
Reading: Chapters 11
Tuesday Nov 8
Topic: Interaction
Lab: Research Paper Reviewing
Reading: Chapters 12
Tuesday Nov 15
Topic: Multiple Views
Lab: Research Paper Presentations
Monday Nov 14
Due: Assignment 5
Thanksgiving Break
Reading: Chapters 13
Tuesday Nov 29
Topic: Sampling and Algorithms
Lab: Prototype Presentation & Feedback
Reading: Chapters 14
Tuesday Dec 6
Topic: TBA Lab:
Tuesday Dec 13
Final Project Demo Day
There are many other great data sources out there. This is a small list to get you started.
Sightline is a Chrome extension that passively collects interactive data visualizations you visit on the web. Sightline's history functionality may help you keep track of and rediscover visualizations you visit throughout the semester.